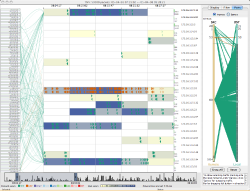
 tnv (The Network Visualizer or Time-based Network Visualizer) depicts network traffic by visualizing packets and links between local and remote hosts.
TNV was mentioned in Russ McRee's toolsmith column in the June 2008 ISSA Journal:
Security Visualization: What you don't see can hurt you (pdf)
tnv is intended for network traffic analysis to facilitate learning what constitutes 'normal' activity on a network, investigating packet details security events, or network troubleshooting. tnv can open saved libpcap (from tcpdump, windump, ethereal, etc.) formatted files or capture live packets on the wire, and export data in libpcap format or save the data to a MySQL database to enable examining trends over time.
The main visualization shows remote hosts along the left side and a reorderable matrix of local hosts on the right, with links drawn between them. The local host matrix shows aggregated packet activity as background color, and shows network packets as triangles, with the point representing the directionality of the packet. Packets and links are color coded to protocol, and the user can optionally show the flags for TCP packets.
By selecting a cell within the matrix, representing a local host for a certain time period, the user can show either the packet details or the port activity related to that host. The main interaction mechanism for moving through the data is a scrollbar that sets the viewable selection, while at the same time showing areas of relative network activity in a bar graph - providing an overview of the entire data set with a more detailed display in the main visualization.
tnv is released under the MIT License.
[tnv : computer network traffic visualization tool]
The development of tnv is sponsored by Secure Decisions, a provider of both software solutions and analytical services to organizations striving to improve information security decisions. We enhance your view of the big picture, and ultimately improve your "cyber defense situational awareness."
| site map | / last.modified • 07.03.08 / |

|

