[tnv : Related Research Papers]
Goodall, John R., Wayne G. Lutters, Penny Rheingans, and Anita Komlodi. "Focusing on Context in Network Traffic Analysis." IEEE Computer Graphics and Applications 26(2), IEEE Press, 2006, 72-80.
Intrusion detection analysis requires understanding the context of an event, usually discovered by examining packet-level detail. When analysts attempt to construct the big picture of a security event, they must move between high-level representations and these low-level details. This continual shifting places a substantial cognitive burden on the analyst, who must mentally store and transfer information between these levels of analysis. This article presents an information visualization tool, the time-based network traffic visualizer (TNV), which reduces this burden. TNV augments the available support for discovering and analyzing anomalous or malicious network activity. The system is grounded in an understanding of the work practices of intrusion detection analysts, particularly foregrounding the overarching importance in the analysis task of integrating contextual information into an understanding of the event under investigation. TNV provides low-level, textual data and multiple, linked visualizations that enable analysts to simultaneously examine packet-level detail within the larger context of activity.
Goodall, John R. "Visualizing Network Traffic for Intrusion Detection," Doctoral Symposium, Proceedings of the ACM Conference on Designing Interactive systems (DIS), ACM Press, 2006, 363-364.
Intrusion detection, the process of using network data to identify potential attacks, has become an essential component of information security. Human analysts doing intrusion detection work utilize vast amounts of data from disparate sources to make decisions about potential attacks. Yet, there is limited understanding of this critical human component. This research seeks to understand the work practices of these human analysts to inform the design of a task-appropriate information visualization tool to support network intrusion detection analysis tasks. System design will follow a user-centered, spiral methodology. System evaluation will include both a field-based qualitative evaluation, uncommon in information visualization, and a lab-based benchmarking evaluation.
Goodall, John R., Wayne G. Lutters, Penny Rheingans, and Anita Komlodi. "Preserving the Big Picture: Visual Network Traffic Analysis with TNV." Proceedings of the Workshop on Visualization for Computer Security (VizSec), IEEE Press, 2005, 47-54.
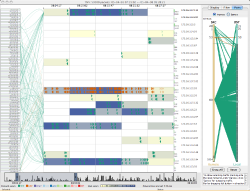
When performing packet-level analysis in intrusion detection, analysts often lose sight of the big picture while examining these low-level details. In order to prevent this loss of context and augment the available tools for intrusion detection analysis tasks, we developed an information visualization tool, the Time-based Network traffic Visualizer (TNV). TNV is grounded in an understanding of the work practices of intrusion detection analysts, particularly foregrounding the overarching importance of context and time in the process of intrusion detection analysis. The main visual component of TNV is a matrix showing network activity of hosts over time, with connections between hosts superimposed on the matrix, complemented by multiple, linked views showing port activity and the details of the raw packets. Providing low-level textual data in the context of a high-level, aggregated graphical display enables analysts to examine packet-level details within the larger context of activity. This combination has the potential to facilitate the intrusion detection analysis tasks and help novice analysts learn what constitutes normal on a particular network.
Goodall, John R., A. Ant Ozok, Wayne G. Lutters, Penny Rheingans, and Anita Komlodi. "A User-Centered Approach to Visualizing Network Traffic for Intrusion Detection." Extended Abstracts of the ACM Conference on Human Factors in Computing Systems (CHI), ACM Press, 2005, 1403-1406.
Intrusion detection (ID) analysts are charged with ensuring the safety and integrity of today's high-speed computer networks. Their work includes the complex task of searching for indications of attacks and misuse in vast amounts of network data. Although there are several information visualization tools to support ID, few are grounded in a thorough understanding of the work ID analysts perform or include any empirical evaluation. We present a user-centered visualization based on our understanding of the work of ID and the needs of analysts derived from the first significant user study of ID. The tool presents analysts with both 'at a glance' understanding of network activity, and low-level network link details. Results from preliminary usability testing show that users performed better and found easier those tasks dealing with network state in comparison to network link tasks.